In the past decade or so, scientists have been astounded to discover that the universe that we can see represents only a tiny fraction of the matter and energy that governs the cosmos. Based on the motion of stars and galaxies, strange “dark matter” must be present, increasing the gravitational tug on celestial bodies more than can be accounted for by visible matter. Further, based on the surprising discovered that the universe is expanding, not contracting under its own gravitational pull as expected, scientists have proposed that a strange, repulsive “dark energy” fills the cosmos countering gravity. The combined effect of these unseen entities, dark energy and dark matter, are so great, that they account for 96% of the matter and energy of the universe. In other words, the visible universe that we used to think is all there is actually is only a tiny fraction of what is there. What we see in the “cosmic org chart” accounts for only 4% of what really influences the cosmos.
It’s that way in the business world. too. Companies can create tidy org charts and draft neat process maps to describe how they work, but the unseen reality outside the visible systems may be what really dominates operations. Increasingly, experts in knowledge management are learning that easily overlooked and often invisible intangibles can dominate corporate value and performance. Numerous intangible transactions may be essential to the success of a company, including casual information sharing between trusted friends, helpful exchanges of tips and best practices between employees or between external partners and internal employees, or loyalty that is gained when people are included in decision making. The invisible linkages and hard-to-observe exchanges in a company’s internal an external ecosystems may be the real engines of value creation, regardless of what is on a process map or workstream. By not understanding the value of such intangibles, corporations can easily break key linkages and crush subtle engines of value creation.
Many companies focus on their “value chains” – a term popularized by Michael Porter in his seminal 1985 work, Competitive Advantage. The value chain describes the linear chain of events as materials and products move from sourcing through manufacturing and out to the market. It is a highly useful paradigm for manufacturing and was highly applicable to much of the economy in the era when Porter was doing his research. But since that time, the explosion of the knowledge economy has changed the way we work and create value. One of my favorite authors, Verna Allee, a revolutionary expert in knowledge management, has detailed the move from the value chain to modern ecosystems and Value Networks in her book, The Future of Knowledge: Increasing Prosperity through Value Networks (Burlington, MA: Elsevier Science, 2003). Verna Allee and Associates have introduced a clever, methodical tool called Value Network Analysis for analyzing and visualizing the transactions of intangibles and tangibles that affect a business.
After my training in Value Network Analysis by Verna and her associate, Oliver Schwabe, an exciting new perspective on business and human behavior opened up. I have been highly impressed with the power of Value Network Analysis and the insights that it can rapidly deliver for a company. The Value Network Analysis work that Innovationedge has done as part of larger projects for some of our clients has been a very exciting part of my work since joining Cheryl Perkins’ exciting company. We value the tool enough that we had Verna Allee speak at the 2008 CoDev conference to introduce other business leaders to the basic concepts behind Value Network Analysis. I’m very pleased to see a community emerging of people using Value Network Analysis and developing exciting tools for it.
Here are some resources that you may find helpful in further exploring this area:
- Value-Networks.com
- Hosted Value Network Tools
- A Value Network Approach (PDF) – 2002 Whitepaper by Verna Allee
- ValueNet Works™ Analysis for the Discovery of Viagra (PDF)
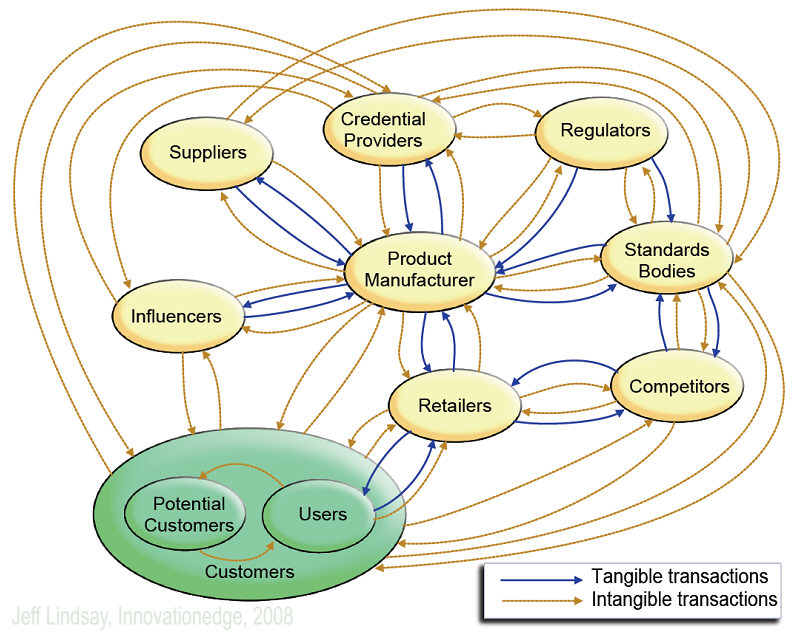
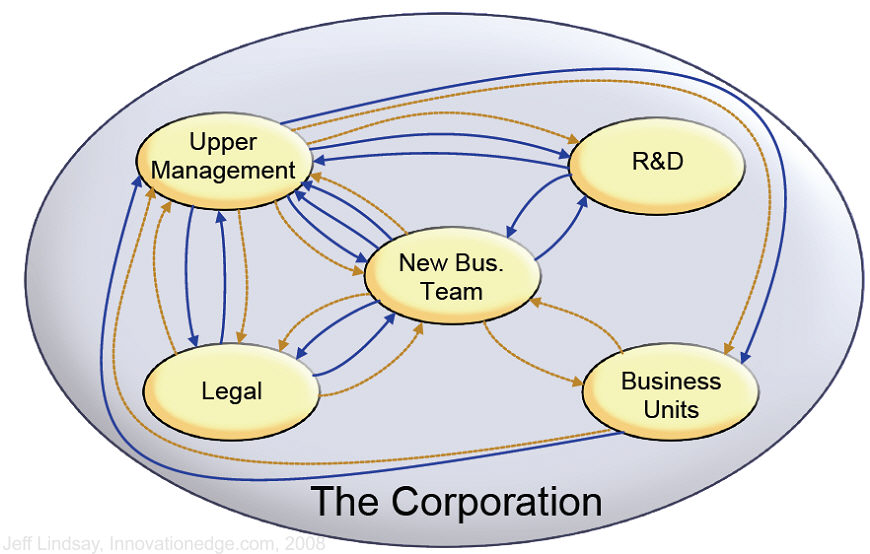
Part of the initial output in Value Network Analysis are maps, called “holomaps,” showing human entities as nodes and transactions of tangible or intangible items between them. There is much that can be learned from such holomaps – a topic for later discussion. For now I’ll show you two sample holomaps I created to illustrate simple ecosystems. One shows several external nodes around a manufacturer and the other shows some structure within part of a corporation. For simplicity, the maps lack all the labels explaining the transactions. (Click to enlarge.)
One interesting approach is to use the “holomaps” you get in Value Network Analysis as tools for “what if” scenarios to explore what new partners might do for your business model, or what new business models might do for your ecosystem. Using holomaps to explore innovation ecosystems is a particularly fruitful approach for those doing open innovation and wondering who should be in their external ecosystem.
We have further information on this topic that we’d be happy to share with you. It’s certainly something you should look at to understand how business really works.


